https://coab.wordpress.com/2010/03/08/quickly-finding-wcf-serializationdeserialization-issues/
Quickly finding WCF Serialization/Deserialization Issues
Once control leaves your code, and heads into the land of WCF serialization, or before it hits your code, when it is in the land of WCF deserialization, you usually don’t have much insight into what’s going on. Yes, you can write your own handlers and step into the process but in most cases, there is no need for that. All you need is a little bit of logging and some error messages to help you catch issues.
Fortunately, Visual Studio comes with a handy little tool called SvcTraceViewer.exe that can help you quickly find issues with serialization or deserialization of your DataContracts.
You need to do the following two steps to quickly find the issue:
Step 1
Tell WCF to start logging out into a file. You can do this by adding the following diagnostic section as a child of the <configuration> tag. But be careful, it has to be after the end of the<congifSections> tag. There are a lot of options and flexibility WCF provides around this tracing, and you can read all about it here. The section below will cause WCF to log out its activity to the file c:\wcf.svclog
<system.diagnostics>
    <sources>
        <source     name="System.ServiceModel"
                    switchValue="Information, ActivityTracing"
                    propagateActivity="true">
            <listeners>
                <add    name="traceListener"
                        type="System.Diagnostics.XmlWriterTraceListener"
                        initializeData= "c:\wcf.svclog" />
            </listeners>
        </source>
    </sources>
</system.diagnostics>
Source: http://msdn.microsoft.com/en-us/library/ms733025.aspx
Step 2
Now that you have set WCF to log out all its activity into c:\wcf.svclog, all you need to do it open that file using the utility SvcTraceViewer.exe. It ships along with Visual Studio (atleast VS 2008 Professional Edition that I have), and it lives in the following folder on my machine.
C:\Program Files\Microsoft SDKs\Windows\v6.0A\bin
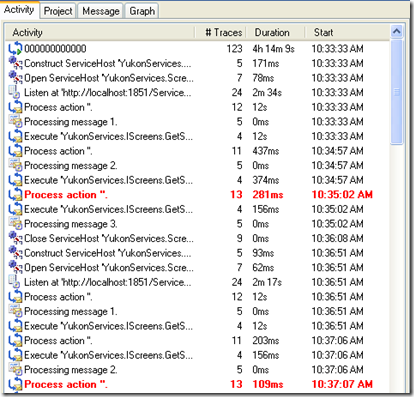
Once you open the trace file in SvcTraceViewer.exe, you will see the log entries (activities). Something like this:
Here you can see that a number of activities are logged and also a couple of errors are pointed out in red.
When I click on one of those error entries, this is what I see on the right side of my SvcTraceViewer window:
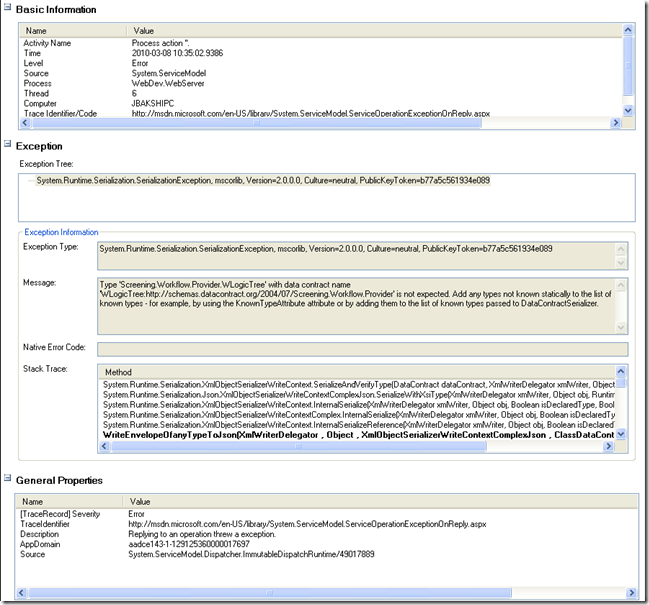
As you can see, all the steps for processing that particular request are listed, and the step that failed is logged out in red. When I click on the step that failed, this is what I see in the bottom pane of my SvcTraceViewer window:
As you can tell from the “Message” field under the “Exception Information” section, the error is pretty clear. While attempting to fulfill a request, WCF ran into an interface that was actually implemented by a type it did not recognize (WLogicTree). I need to tell it about the type. I can do this by adding it to the ServiceKnownTypes list.
In short, once you know how to use tools like SvcTraceViewer, and understand some of WCF rules for serialization and deserialization, it is not very painful to catch most errors.
Happy debugging!


